Book traversal links for 2.4.4 Potential total yield of true TB cases
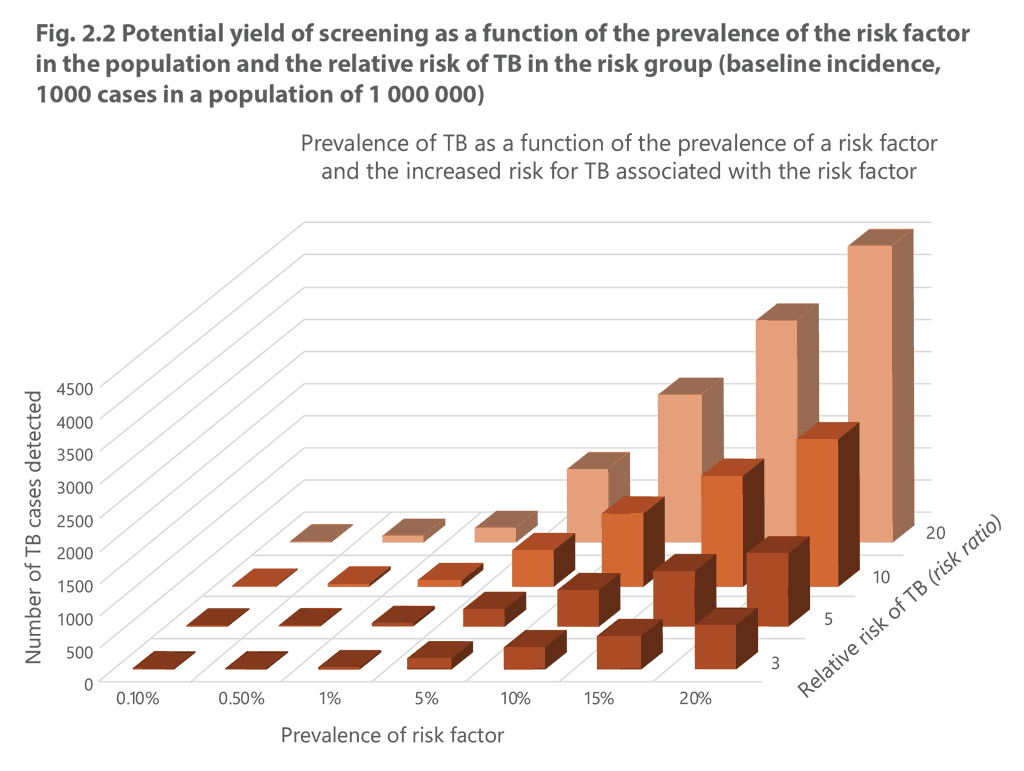
Fig. 3 shows the potential yield of screening in a range of hypothetical risk groups with a range of relative risks of TB (assuming 100% coverage, acceptance of screening, sensitivity and specificity of screening). As illustrated in Fig. 2.2, the yield of TB screening in a specific risk group (in terms of the number of TB cases detected; y axis) depends on both the size of the risk group (i.e. the prevalence of the risk factor in the general population; x axis) and the relative risk of TB for that risk group (z axis). The yield is also affected by the acceptance of screening in the risk group (see 2.2.2) and the sensitivity of the approach (see Chapter 3).

Often, the groups at highest risk of TB are also the smallest, and groups with only a moderately elevated risk may be very large. For example, the population prevalence of HIV, which is associated with an increase in risk of up to 20 times, is usually less than 1% (except in some countries in subSaharan Africa), and the total number of close contacts of someone with TB (who also have a dramatically elevated TB risk) is usually a very small fraction of the total population. Nevertheless, risk factors such as having diabetes or undernutrition or living in a crowded slum, which usually pose moderate relative risks for TB (in the range of 2–3) could affect more than 10% of the total population.
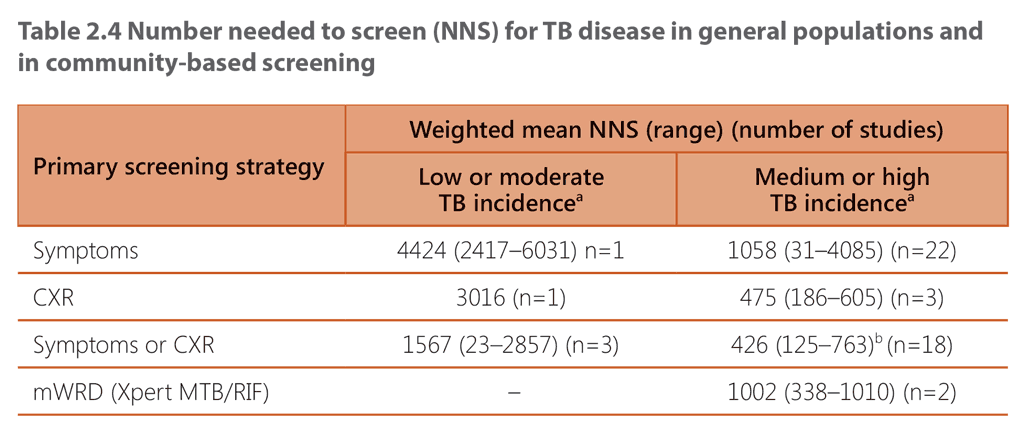
Therefore, screening the highest-risk groups often gives a low total yield in terms of the absolute number of TB cases detected. A high overall yield from screening may be possible only by achieving very high coverage of screening in large groups that have a moderate increase in the risk of TB; however, screening of these groups will generally require a higher NNS and might result in a higher cost per case detected than screening of groups at very high risk. The risk of a false-positive diagnosis is also higher in these groups. Therefore, there is often a difficult trade-off between the desire to achieve a large total yield and cost–effectiveness. Table 2.4 shows the NNS for TB disease with different screening approaches by burden setting, as estimated from the studies reviewed for the latest guidelines on TB screening. Similar estimates for other risk groups are given in Web Annex C of the screening guidelines.

ᵃ Low or moderate TB incidence (up to 100/100 000 population), medium or high TB incidence (> 100/100 000 population)
ᵇ 15 studies with 18 cohorts
 Feedback